
REPORTS
Discover why thousands of organizations trust EBS's platform to securely deliver self-service BI and data discovery to their users. It’s easy to learn for everyone. Most reporting requests are minor changes that users can learn to get themselves. Alter existing reports by adding fields, filters or pivots and save a new variation in seconds.
DASHBOARDS
Deliver responsive, real-time visualizations with HTML5 powered dashboards. Slice and dice data with pivots and analysis grids. Works on desktop and mobile. Executives love seeing the important details in one screen. EBS provides rich interactive dashboards for instant insight.
Add Ad-Hoc Reports and Dashboards to Your Application
Last quarter’s data isn’t relevant to today’s challenges. EBS Reports helps end-users stay competitive by providing real-time analytics for everyone, everywhere. From a critical presentation in the boardroom to a quick check via cellphone, users can create and immediately view reports, without relying on IT.
Operational
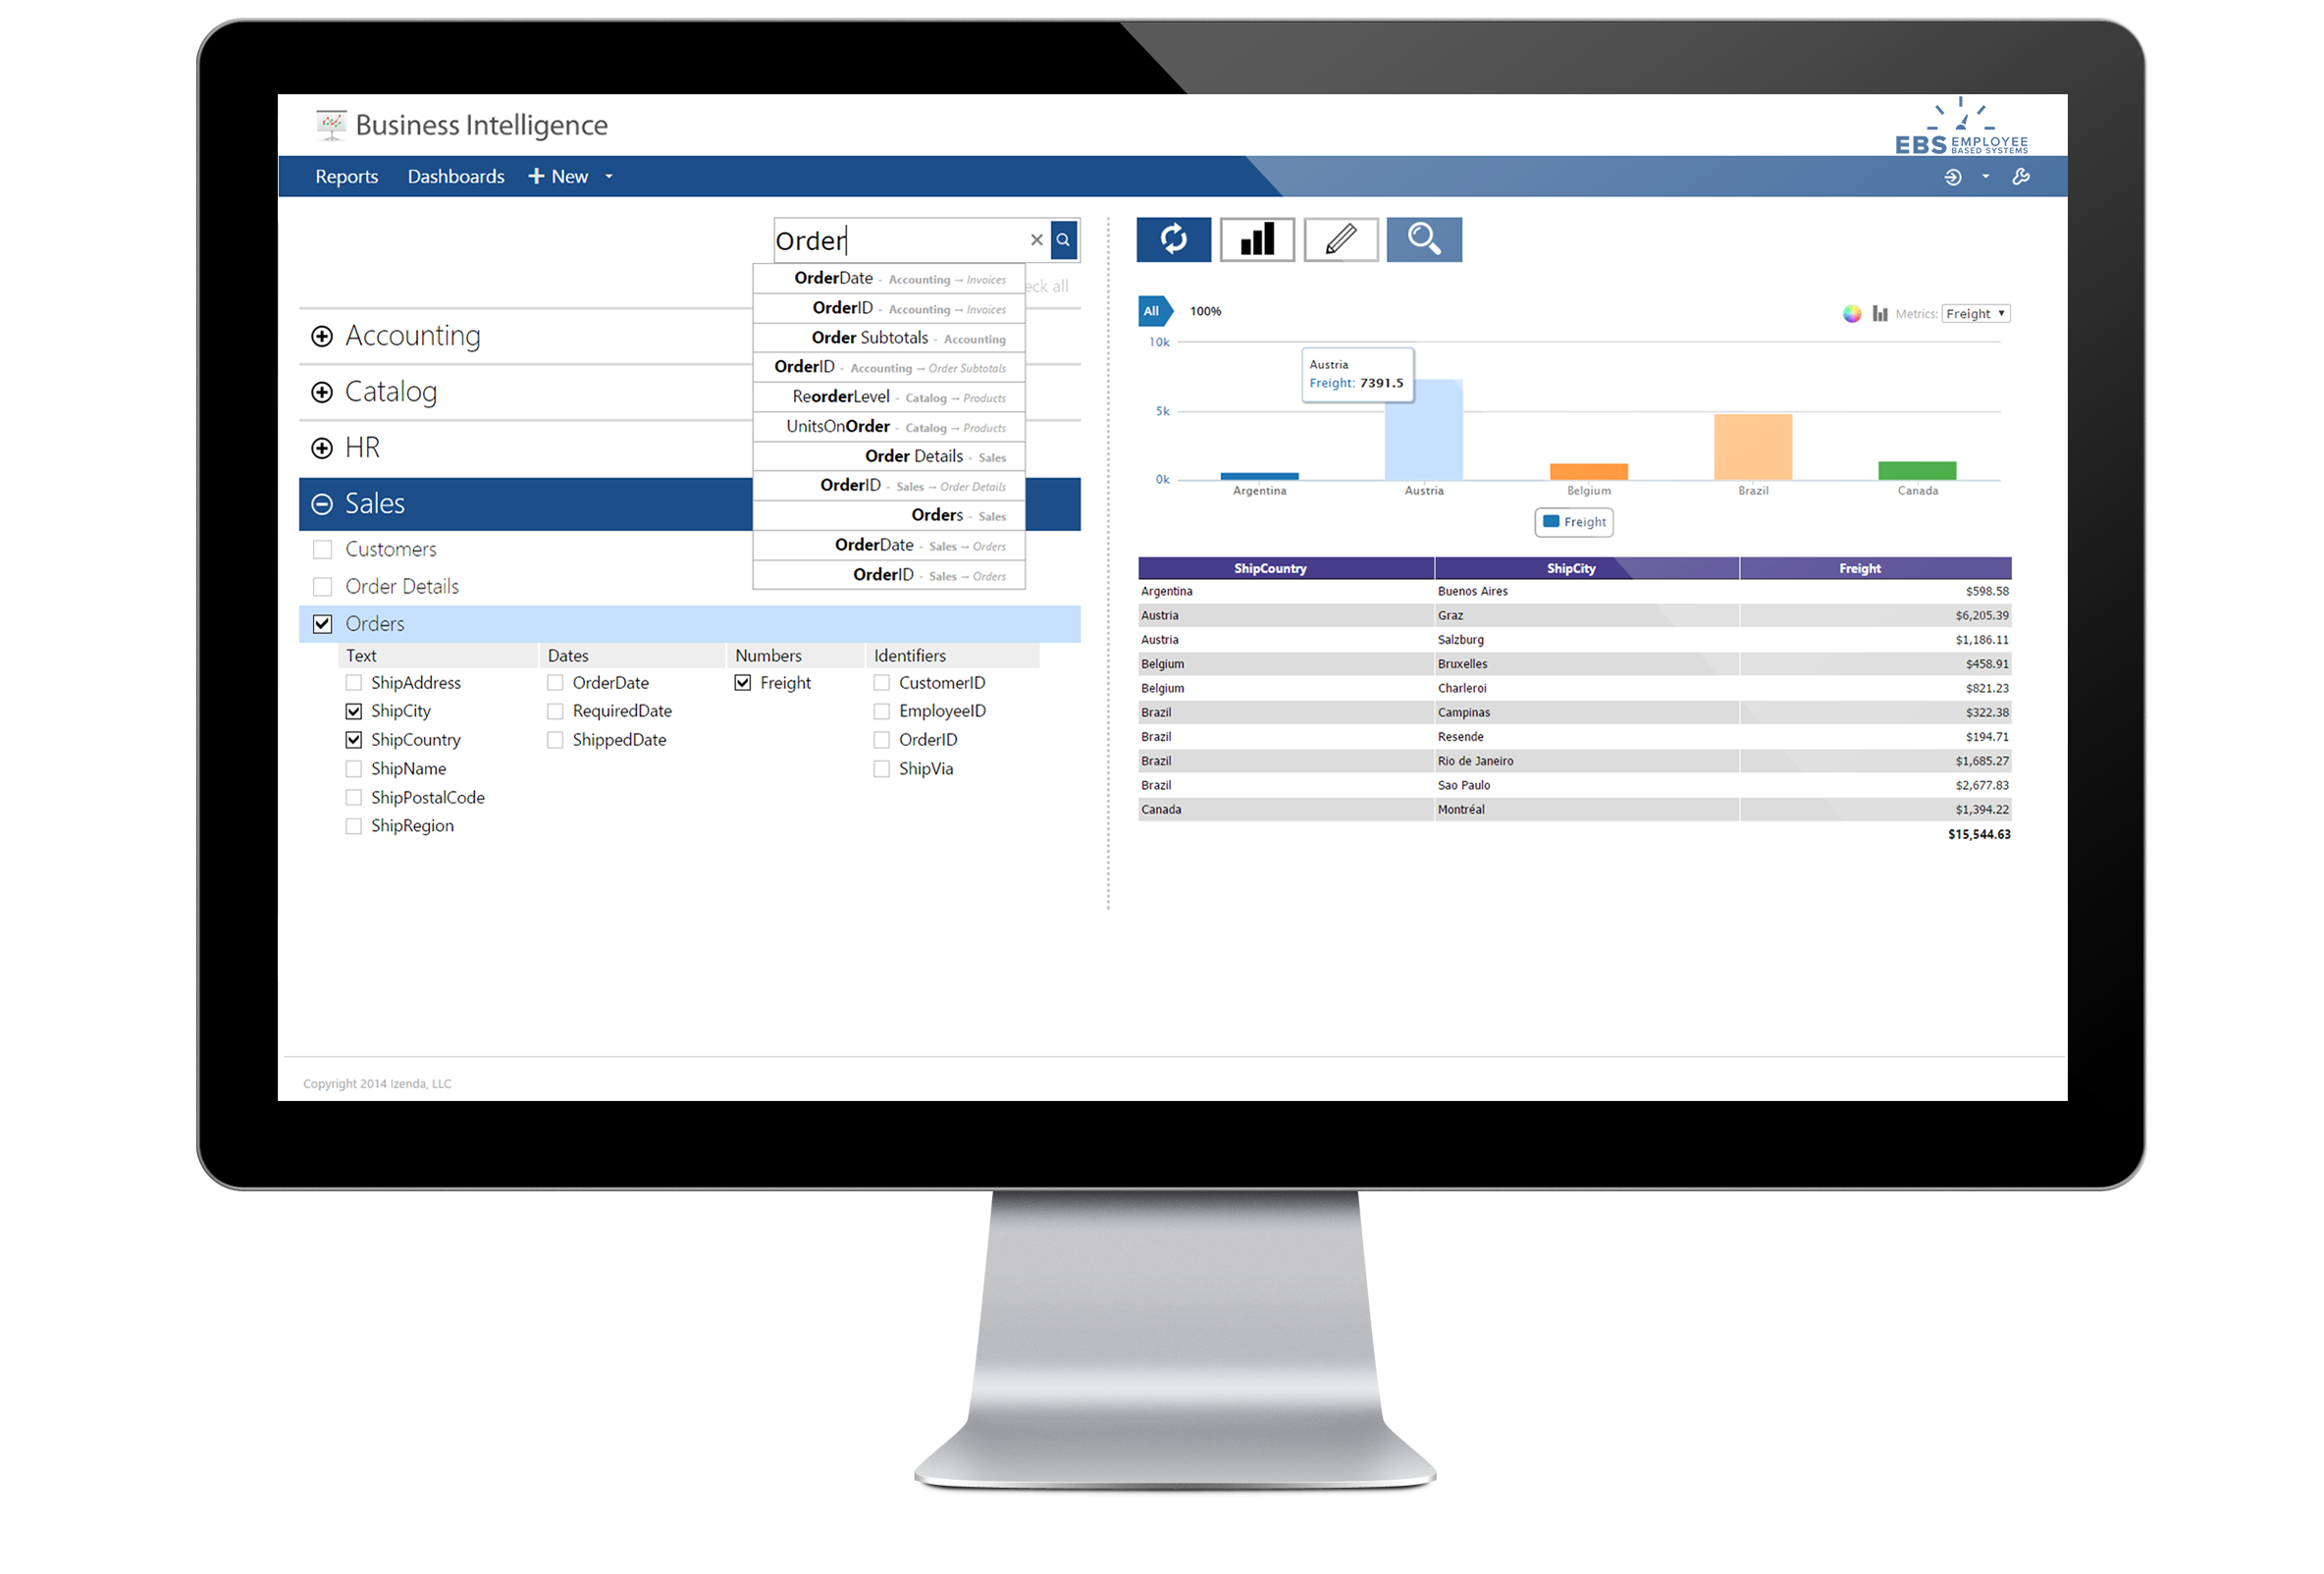
For users who thrive on Microsoft Excel, EBS provides full support for detail-oriented operational reports needed to keep day-to-day business operations moving. You have the power to slice and dice data with dynamic pivots and analysis grids.
Discoverable
EBS has been built from the ground up with self-service customization in mind. From a critical presentation in the boardroom to casual analysis on a Sunday afternoon, you’ll have the flexibility to manipulate existing reports in new ways. This is the most important part of next generation analytics.
Flexible
Modern users want instant insights into massive data sets. EBS’s easy-to-learn Instant Reports technology starts with a Google-like search. Discover data you didn’t even know you had or start building reports even if you don’t fully understand the data model.
Give Users Customizable Dashboards
Dashboards are a dynamic and interactive way to view critical information from multiple sources in a single view. Users can hover over a report to get details, or drill down into it for greater insight. Users can create and customize their own dashboards, then use them to print, save, share and send reports. Security options let you decide who can view or make edits.
Interactive
As data scales to trillions of records, grid-based analysis is no longer enough to find important patterns. Clarify live data with rich dashboards, drill-down reports and data hierarchies to discover new patterns and trends.
Analytical
Stay competitive in today’s global marketplace by responding quickly to real-time dashboards. EBS delivers self-service analytics that anyone in the user community can take advantage of, not just the analysts. Executives, managers and staff can drill-down data with our dashboards without waiting for IT or data scientists.
Customizable
Most reporting requests are minor changes that users can learn to get themselves. Alter existing reports and dashboards by adding fields, filters or pivots and save a new variation in seconds. Deploy with a library of core reports and dashboard templates, and let users address their own complexities.